Well, not exactly but end of the line for this semester. This will be continued next semester and the semester after that.
Well, not exactly but end of the line for this semester. This will be continued next semester and the semester after that.
On to the juicy stuff, but first a review of the last two semesters. This project started as a way to capture the record of the kinetic energy of a pendulum. The idea was to have the pendulum attached to a moving point in hopes of brining some chaos into the movement. The first iteration of the design had the pendulum attached to a compound lever arm which in turn was attached to a stepper motor. A remote control allowed the user to change the direction and speed of the stepper. At the bottom of the pendulum an RGB LED cycled through the spectrum creating a “trail” or path the pendulum traveled. A camera was placed under the pendulum’s area of travel and using a long exposure the path was captured and documented. Below is the visual documentation associated with the first part of the project.

Original pendulum bob design

original compound lever design
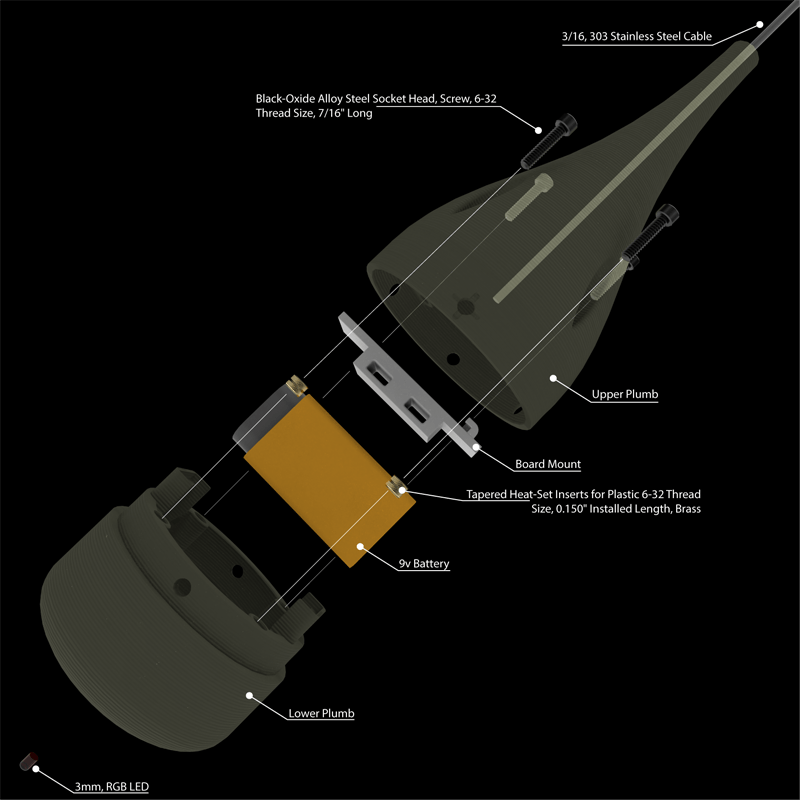
exploded view of pendulum bob
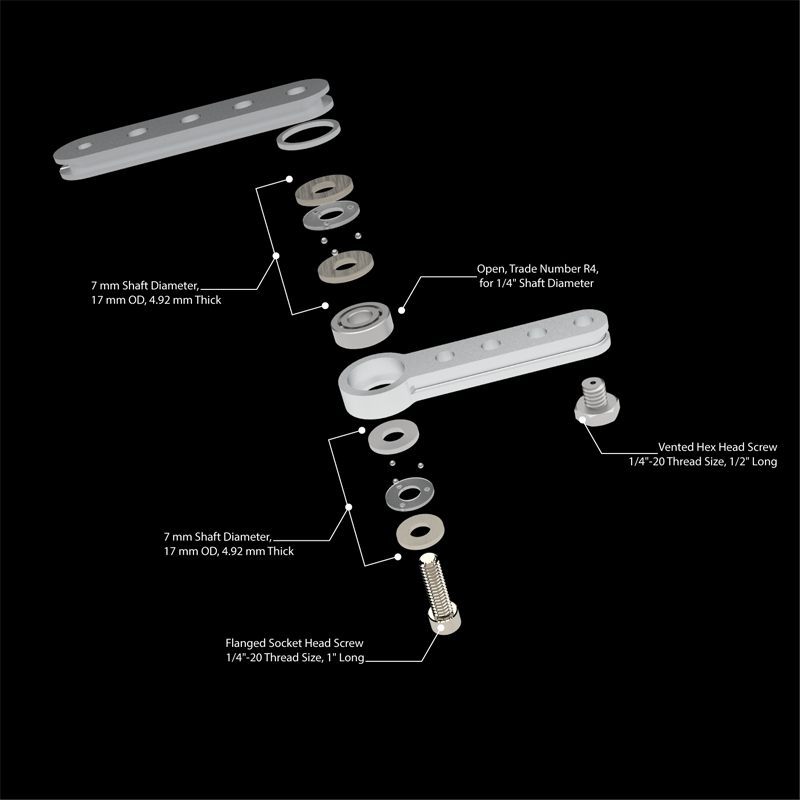
Exploded view of compound lever arm

Assembly of pendulum

Assembly of compound lever arm

Pendulum bob prototype

Pendulum bob with microcontroller and RGB LED

Finished controlled next to the breadboard prototype

Original setup for image capture

Original setup for image capture

Original image output

Original image output

Original image output

Original image output

Original image output

Original image output
After completing the previous phase of the project I wanted to push it further, the output (images) were engaging but lacked variety. I wanted to find a way to change that.
I also wanted to think about how this project was going to be viewed and interacted with by the public. Originally the output image was going to be a lasting artifact, something akin to a light painting, however, this felt a nit shallow and lacked meaning. One of the small milestones during this class was to write a “Dream Review”, in doing this I was very critical of the overall point of the project. I wanted this to be a large installation and I wanted it to be more about the experience than the image outputs. I thought about how each exposure was one minute, and each exposure acted as a snapshot in time. So what happens to this project if I play on TIME? Thinking about a minute, a clock, and life cycles in general I started to evolve the concept of the project to a room sized installation. The pendulum and camera would still have all the same attributes. Users could interact with controls to change the image outputs via movements of the pendulum motor. The image outputs would not be lasting, instead each image collected would be projected sequentially around the room. Each image output would be displayed in each of 60 positions for one minute. After the image traveled the perimeter of the room it would “fall off” and would be gone forever. No record of the image outputs would be kept.
At this point the project has taken on new meaning, about the fleetingness of time and permanence of death. Below is a visualization of the installation.

View from the control station

View from entryway

Plan view of installation

Plan view of installation with callouts
So at this point I had a few parts of this project to consider. At the onset of this semester these were the points I thought I needed to look into.
- Re-configure linkage
- Wireless communication between controller and LED board
- Wireless communication between controller and motor
- Figure out how to use directional data for RGB LED color
- Figure out how to use velocity data for RGB LED color
- Figure out how to use speed data for RGB LED color
- Figure out what “chaos” means for RGB LED color
- Make adjustments to the pendulum components
After reconfiguring the linkage to make it more stable and move more freely, I took a step back to analyze the movements, and the outputs, of the pendulum. I realize now that this probably should have been the first step in the process. But as they say hindsight is 20/20. I spent a few days looking at the path of the pendulum and came to the conclusion that in order to change the output image drastically I needed to change how the pendulum moved.
I looked into different types of movement to determine be the best system for this application and landed on an X/Y gantry system. This type of system would allow for an infinite number of different movements. The pendulum would be connect to a carriage that has movement in both X and Y. Below is a diagram illustrating this principle.

Visualization of single point vs X/Y gantry movement
I wanted a simple low-fi way to test to see if the X/Y gantry system would have the desired output. So I made a quick bounding box out of paper and held the pendulum above the camera and moved it with my hand. Even though this is analog and not very precise, it emulates the type of movements that an X/Y gantry is capable of. Below are a few examples of the image outputs form this experiment.

Image output from low-fi experiment

Image output from low-fi experiment

Image output from low-fi experiment

Image output from low-fi experiment

Image output from low-fi experiment

Image output from low-fi experiment

Image output from low-fi experiment

Image output from low-fi experiment

Image output from low-fi experiment
I lost some a lot of time backtracking to figure out how the system should move. During that time the class gave some great feedback regarding the interaction of the control station. The explicate interactions of the control station didn’t really make sense in this context, rather using implied or indirect interactions may be better. I decide to incorporate this feedback into the project and will have two variables for each axis, speed and distance. Sensors will provide the data to be used for each of the variables. I’m currently working with an Adafruit VL53L0X Time-of-flight sensor and a Pololu Tic T834 stepper driver to work out the code for the movement. I’m implementing smoothing on the raw data provided by the VL53L0X in order to provide a more stable set of movement instructions to the motor driver. Below is the current code that I’m working on.
/*
  Smoothing

  Reads repeatedly from an analog input, calculating a running average and
  printing it to the computer. Keeps ten readings in an array and continually
  averages them.

  The circuit:
  - analog sensor (potentiometer will do) attached to analog input 0

  created 22 Apr 2007
  by David A. Mellis  <dam@mellis.org>
  modified 9 Apr 2012
  by Tom Igoe

  This example code is in the public domain.

  http://www.arduino.cc/en/Tutorial/Smoothing
*/

// Define the number of samples to keep track of. The higher the number, the
// more the readings will be smoothed, but the slower the output will respond to
// the input. Using a constant rather than a normal variable lets us use this
// value to determine the size of the readings array.
#include "Adafruit_VL53L0X.h"

Adafruit_VL53L0X lox = Adafruit_VL53L0X();
unsigned long startMillis;
unsigned long currentMillis;
const unsigned long period = 4000;
const int numReadings = 10;

int readings[numReadings];      // the readings from the analog input
int readIndex = 0;              // the index of the current reading
int total = 0;                  // the running total
int average = 0;                // the average

int distance = 0;
//int inputPin = A4;

void setup() {
  // initialize serial communication with computer:
  Serial.begin(115200);

  // initialize all the readings to 0:
  for (int thisReading = 0; thisReading < numReadings; thisReading++) {
    readings[thisReading] = 0;
  }

  // wait until serial port opens for native USB devices
  while (! Serial) {
    delay(1);
  }

  Serial.println("Adafruit VL53L0X test");
  if (!lox.begin()) {
    Serial.println(F("Failed to boot VL53L0X"));
    while (1);
  }
  // power
  Serial.println(F("VL53L0X API Simple Ranging example\n\n"));
  startMillis = millis();  //initial start time
}

void loop() {
  currentMillis = millis();

  VL53L0X_RangingMeasurementData_t measure;
  distance = measure.RangeMilliMeter;


  lox.rangingTest(&measure, false); // pass in 'true' to get debug data printout!
  delay(100);

  // subtract the last reading:
  total = total - readings[readIndex];
  // read from the sensor:
  //  readings[readIndex] = analogRead(inputPin);
  readings[readIndex] = distance;
  // add the reading to the total:
  total = total + readings[readIndex];
  // advance to the next position in the array:
  readIndex = readIndex + 1;

  // if we're at the end of the array...
  if (readIndex >= numReadings) {
    // ...wrap around to the beginning:
    readIndex = 0;
  }

  // calculate the average:
  average = total / numReadings;
  int  steps = map(average, 0, 9000, -400, 400);
  // send it to the computer as ASCII digits
  Serial.print("Distance"); Serial.println(distance);
  Serial.print("Average"); Serial.println(average);

  if (currentMillis - startMillis <= period) {
    analogWrite(A0, steps);
    //  delay(5000);        // delay in between reads for stability
  }
  startMillis = currentMillis;
}
The other big change that I haven’t mention yet is the way the RGB LED will react to the movements. Originally the LED just cycled through the RGB spectrum, again this felt a bit disconnected to the overall theme and even the mechanical process by which the images outputs were made. At this point the plan is to use the X/Y location of the carriage to change the HSL value of the RGB LED. This should produce fairly chaotic results even though the carriage position will always produce the same RGB value the position of the pendulum will very rarely be directly under the carriage. So the colors in the image output will never be in the same location.
I’ve made good headway in fully conceptualizing the installation in what could be the final form but there is still a long way to go for realization.

Current state of the motor interfacing with the VL530X


