Listening to more of You
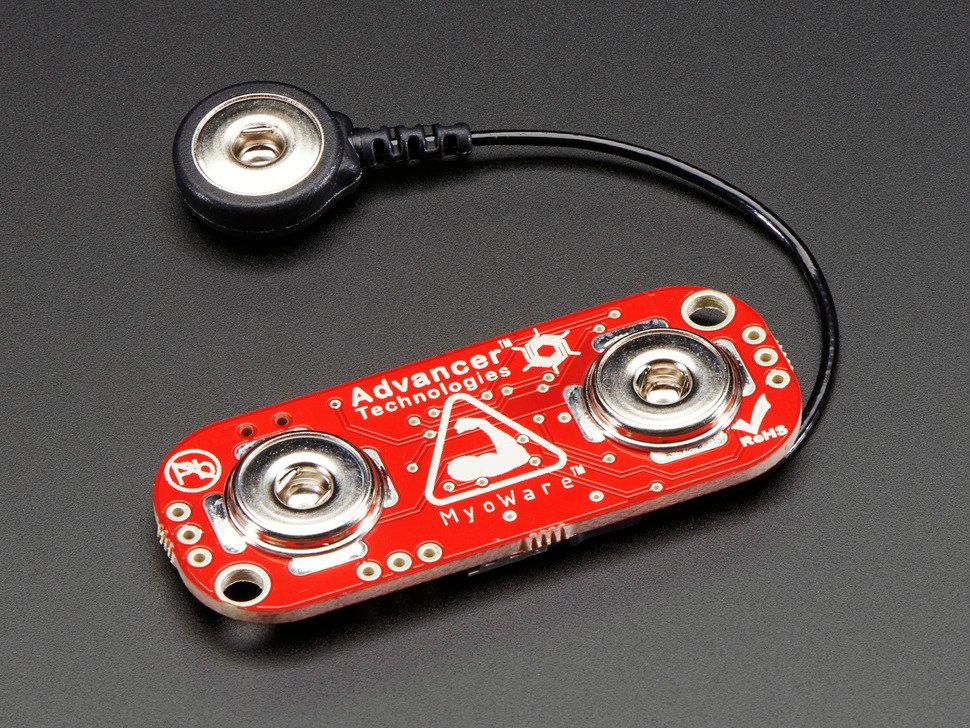
I tend to have random high levels of anxiety from time to time and I know I hold a lot of stress in my left shoulder area. I wondered if I could get any kind of signal from that are, and using a MyoWare Muscle sensor I found out that I do have a lot of spikes while working at the computer.
I tested this over the course of 1 hour and the sensor returned about, 104k data points. I graphed those points in three different ways. Below are the graphs.
I used Serial Studio to export the data from the sensor into a .csv file and in turn brought the data into Xcel in order to generate the graphs. I believe Serial Studio would graph in real-time with the addition of a JSON file, but I did not have time to explore that option.
I would like to film myself while gathering this data to see if there are certain positions that cause the same type of data spikes. Using the video and plotting it against the data points might give a better understanding of the data and what it suggests.
I used very simple code on the Arduino Nano IoT 33.
void setup() {
  // initialize serial communication at 9600 bits per second:
  Serial.begin(9600);
}

void loop() {
  // read the input on analog pin 0:
  int sensorValue = analogRead(A0);
  // print out the value you read:
  Serial.println(sensorValue);
  delay(1);        // delay in between reads for stability
}
I also took the output data into p5 in real-time to look at a rolling graph. I will need to re-record the output but the code is below.
let xPos = 0;
let serial;          // variable to hold an instance of the serialport library
let portName = 'COM3';  // fill in your serial port name here
let inData;                             // for incoming se

function setup() {
  createCanvas(1200, 500);
  background(0x08, 0x16, 0x40);
  serial = new p5.SerialPort();       // make a new instance of the serialport library
  serial.list();
  serial.open('COM3');
  serial.on('list', printList);  // set a callback function for the serialport list event
  serial.on('connected', serverConnected); // callback for connecting to the server
  serial.on('open', portOpen);        // callback for the port opening
  serial.on('data', serialEvent);     // callback for when new data arrives
  serial.on('error', serialError);    // callback for errors
  serial.on('close', portClose);      // callback for the port closing

  // serial.list();                      // list the serial ports
  // serial.open(portName);              // open a serial port

}

function graphData(newData) {
  // map the range of the input to the window height:
  var yPos = map(newData, 0, 255, 0, height);
  // draw the line in a pretty color:
  stroke(0xA8, 0xD9, 0xA7);
  line(xPos, height, xPos, height - yPos);
  // at the edge of the screen, go back to the beginning:
  if (xPos >= width) {
    xPos = 0;
    // clear the screen by resetting the background:
    background(0x08, 0x16, 0x40);
  } else {
    // increment the horizontal position for the next reading:
    xPos++;
  }
}

// get the list of ports:
function printList(portList) {
  // portList is an array of serial port names
  for (var i = 0; i < portList.length; i++) {
    // Display the list the console:
    console.log(i + portList[i]);
  }
}

function serverConnected() {
  console.log('connected to server.');
}

function portOpen() {
  console.log('the serial port opened.')
}

function serialEvent() {
 inData = Number(serial.read());
}

function serialError(err) {
  console.log('Something went wrong with the serial port. ' + err);
}

function portClose() {
  console.log('The serial port closed.');
}

function draw(){
  // background(0);
   // fill(255);
   // text("sensor value: " + inData, 2, 10);
  graphData(inData);
}
Working p5 Sketch


