

Origin-Character
The infrastructure of Hamburger City is coming along. A few characters have been introduced. My contribution is Thalmond Rowe. Full character origin is below.
Thalmond Rowe
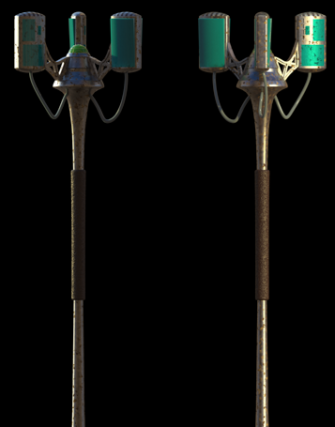
Born the only son of Talhrian immigrants, pale and feeble as a newborn, he was given up for adoption at 13 days old. Left at the Time Center wrapped in a tattered blanket placed in a pink cowboy hat. His childhood was riddled with taunting and name calling because of his origin as an orphan and a Talhrain. Now, dear reader, please realize Talharians present as human for the most part, save for the piercing neon green eyes and skin the color of the Void. Thalmond outgrew his pale skin, shedding it like a snake does to reveal a complete void of darkness with little no light reflecting off his skin. Talharians also possess a keen sense of smell rivaled only by African Elephants and perhaps the best eyesight in the known universe. So it comes as no surprise that Thalmond is aces with a rifle. He has taken to thinking of himself as somewhat of a gunslinger for hire, if you will. Most would call him a wetworker or assassin. When not on the job he still wears that pink cowboy hat.
He never had much of a taste for education so once he aged out of the system studying was a thing of the past. He hustled any way he could for many years. Billiards, cards, you name it he tried. His antics got him caught up in a slightly sticky situation, where he allegedly played the part of the fool in a card game gone wrong. His debt couldn’t be paid in any traditional manner, but it did make him the man he is today. He became the assistant/apprentice to Ol’ Larry Grouper. Grouper was considered to be the best there was when it came to killing. He often quoted the Great James Howllet, “ I’m the best there is at what I do, but what I do Isn’t very nice”. Now, Thalmond didn’t take to this type of gunman-for-hire type of mentality, well, he took to it in his own way and only killed for the greater good of society. On the “good guys side”, you might ask yourself how did he know he was on the “good guys side”? ANd the answer to that my friend is simple, if one day you find yourself asking that question, then you sir, are not on the “good guys side”.
He doesn’t and hasn’t ever taken payment for his “duties” and as he says “I always seem to be taken care of”. He really believes that is righting wrongs that have befell Hamburger City, and the people agree with him. He works alone, against governmental bodies such as the AI and Thought Police as well as private citizens that cause harm to the good people of Hamburger City.

50 Days Wrapped

A Place…
Welcome to remote collaborative world building. 18 students met for 7 weeks to collectively build a world in which an interactive comic would live. Using only the facilitation skills of Prof. Tony Patrick, a MURAL board, and the imagination of the class.
Below you will find the link to the MURAL
Give the origin story for a place located in the Hamburger City world.
The Life Factory
In the failing light of 2068 the LIFE FACTORY (LF) exists to prolong and in some cases duplicate life. A vast monolithic structure stands in the dry sands of the desert, adorned with little to know detail save for the piercing blue light emanating from small rectangular openings in the surface of the structure. A single door sits as close to the left side on each of four faces of the building. The door stands twice that of any being still living on this dying planet. Running the length of the door and only a few inches wide a dimly illuminated stripe sits just raised for the surface of the door. One can postulate that this stripe is how you would gain access into the LF, however, the LF is reserved for those considered to be Methusela’s children.
Great flying objects hover over the monolith and descend into the structure, oddly enough this seems to be a one-way entrance. There must be some subterranean passageway that leads from the lower levels of the LF. In the great silence that is the desert the whirring of the LF is barely audible but still produces an unsettling feeling to those who dwell miles from the source. About 150 yards from the monolith lies a ring of small, about a foot in diameter, holes which constantly produce a copper colored gas, thick as the ash that falls from the north. The noxious smell associated with the gas can be sensed from as far away as 10 miles, within one mile of the monolith a breathing device is recommended for those who still have olfactory senses. It burns the eyes and causes irritation in the throat.
One side of the building is home to a large pipeline, it must be 25 feet in diameter and raised at least 200 feet off the ground. The assumption is this pipeline delivers water to the LF. Water is the life-giver and thus must be used in the processes within the LF. Great statutes whose features have been worn away by time, parallel the pipeline on each. Stabbing nearly shoulder to shoulder as they fade into the distance. No one has been to the end of the pipeline, the distance too great to travel by any means the lower class possesses, and the upper classes don’t care where it comes from, only that they are entitled to the use of what it carries for their own personal gains.
The End of the Line…
Well, not exactly but end of the line for this semester. This will be continued next semester and the semester after that.
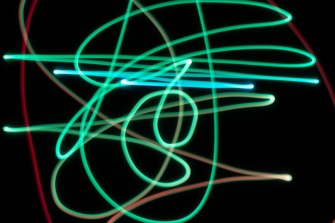
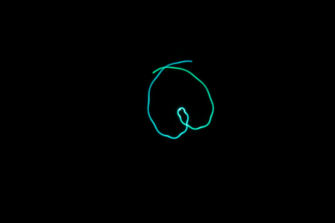
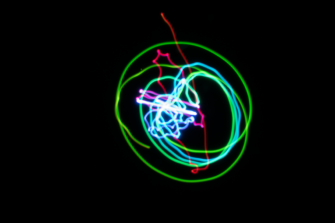
On to the juicy stuff, but first a review of the last two semesters. This project started as a way to capture the record of the kinetic energy of a pendulum. The idea was to have the pendulum attached to a moving point in hopes of brining some chaos into the movement. The first iteration of the design had the pendulum attached to a compound lever arm which in turn was attached to a stepper motor. A remote control allowed the user to change the direction and speed of the stepper. At the bottom of the pendulum an RGB LED cycled through the spectrum creating a “trail” or path the pendulum traveled. A camera was placed under the pendulum’s area of travel and using a long exposure the path was captured and documented. Below is the visual documentation associated with the first part of the project.
After completing the previous phase of the project I wanted to push it further, the output (images) were engaging but lacked variety. I wanted to find a way to change that.
I also wanted to think about how this project was going to be viewed and interacted with by the public. Originally the output image was going to be a lasting artifact, something akin to a light painting, however, this felt a nit shallow and lacked meaning. One of the small milestones during this class was to write a “Dream Review”, in doing this I was very critical of the overall point of the project. I wanted this to be a large installation and I wanted it to be more about the experience than the image outputs. I thought about how each exposure was one minute, and each exposure acted as a snapshot in time. So what happens to this project if I play on TIME? Thinking about a minute, a clock, and life cycles in general I started to evolve the concept of the project to a room sized installation. The pendulum and camera would still have all the same attributes. Users could interact with controls to change the image outputs via movements of the pendulum motor. The image outputs would not be lasting, instead each image collected would be projected sequentially around the room. Each image output would be displayed in each of 60 positions for one minute. After the image traveled the perimeter of the room it would “fall off” and would be gone forever. No record of the image outputs would be kept.
At this point the project has taken on new meaning, about the fleetingness of time and permanence of death. Below is a visualization of the installation.
So at this point I had a few parts of this project to consider. At the onset of this semester these were the points I thought I needed to look into.
- Re-configure linkage
- Wireless communication between controller and LED board
- Wireless communication between controller and motor
- Figure out how to use directional data for RGB LED color
- Figure out how to use velocity data for RGB LED color
- Figure out how to use speed data for RGB LED color
- Figure out what “chaos” means for RGB LED color
- Make adjustments to the pendulum components
After reconfiguring the linkage to make it more stable and move more freely, I took a step back to analyze the movements, and the outputs, of the pendulum. I realize now that this probably should have been the first step in the process. But as they say hindsight is 20/20. I spent a few days looking at the path of the pendulum and came to the conclusion that in order to change the output image drastically I needed to change how the pendulum moved.
I looked into different types of movement to determine be the best system for this application and landed on an X/Y gantry system. This type of system would allow for an infinite number of different movements. The pendulum would be connect to a carriage that has movement in both X and Y. Below is a diagram illustrating this principle.
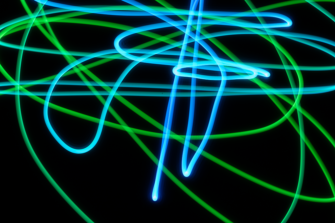
I wanted a simple low-fi way to test to see if the X/Y gantry system would have the desired output. So I made a quick bounding box out of paper and held the pendulum above the camera and moved it with my hand. Even though this is analog and not very precise, it emulates the type of movements that an X/Y gantry is capable of. Below are a few examples of the image outputs form this experiment.
I lost some a lot of time backtracking to figure out how the system should move. During that time the class gave some great feedback regarding the interaction of the control station. The explicate interactions of the control station didn’t really make sense in this context, rather using implied or indirect interactions may be better. I decide to incorporate this feedback into the project and will have two variables for each axis, speed and distance. Sensors will provide the data to be used for each of the variables. I’m currently working with an Adafruit VL53L0X Time-of-flight sensor and a Pololu Tic T834 stepper driver to work out the code for the movement. I’m implementing smoothing on the raw data provided by the VL53L0X in order to provide a more stable set of movement instructions to the motor driver. Below is the current code that I’m working on.
/*
  Smoothing

  Reads repeatedly from an analog input, calculating a running average and
  printing it to the computer. Keeps ten readings in an array and continually
  averages them.

  The circuit:
  - analog sensor (potentiometer will do) attached to analog input 0

  created 22 Apr 2007
  by David A. Mellis  <dam@mellis.org>
  modified 9 Apr 2012
  by Tom Igoe

  This example code is in the public domain.

  http://www.arduino.cc/en/Tutorial/Smoothing
*/

// Define the number of samples to keep track of. The higher the number, the
// more the readings will be smoothed, but the slower the output will respond to
// the input. Using a constant rather than a normal variable lets us use this
// value to determine the size of the readings array.
#include "Adafruit_VL53L0X.h"

Adafruit_VL53L0X lox = Adafruit_VL53L0X();
unsigned long startMillis;
unsigned long currentMillis;
const unsigned long period = 4000;
const int numReadings = 10;

int readings[numReadings];      // the readings from the analog input
int readIndex = 0;              // the index of the current reading
int total = 0;                  // the running total
int average = 0;                // the average

int distance = 0;
//int inputPin = A4;

void setup() {
  // initialize serial communication with computer:
  Serial.begin(115200);

  // initialize all the readings to 0:
  for (int thisReading = 0; thisReading < numReadings; thisReading++) {
    readings[thisReading] = 0;
  }

  // wait until serial port opens for native USB devices
  while (! Serial) {
    delay(1);
  }

  Serial.println("Adafruit VL53L0X test");
  if (!lox.begin()) {
    Serial.println(F("Failed to boot VL53L0X"));
    while (1);
  }
  // power
  Serial.println(F("VL53L0X API Simple Ranging example\n\n"));
  startMillis = millis();  //initial start time
}

void loop() {
  currentMillis = millis();

  VL53L0X_RangingMeasurementData_t measure;
  distance = measure.RangeMilliMeter;


  lox.rangingTest(&measure, false); // pass in 'true' to get debug data printout!
  delay(100);

  // subtract the last reading:
  total = total - readings[readIndex];
  // read from the sensor:
  //  readings[readIndex] = analogRead(inputPin);
  readings[readIndex] = distance;
  // add the reading to the total:
  total = total + readings[readIndex];
  // advance to the next position in the array:
  readIndex = readIndex + 1;

  // if we're at the end of the array...
  if (readIndex >= numReadings) {
    // ...wrap around to the beginning:
    readIndex = 0;
  }

  // calculate the average:
  average = total / numReadings;
  int  steps = map(average, 0, 9000, -400, 400);
  // send it to the computer as ASCII digits
  Serial.print("Distance"); Serial.println(distance);
  Serial.print("Average"); Serial.println(average);

  if (currentMillis - startMillis <= period) {
    analogWrite(A0, steps);
    //  delay(5000);        // delay in between reads for stability
  }
  startMillis = currentMillis;
}
The other big change that I haven’t mention yet is the way the RGB LED will react to the movements. Originally the LED just cycled through the RGB spectrum, again this felt a bit disconnected to the overall theme and even the mechanical process by which the images outputs were made. At this point the plan is to use the X/Y location of the carriage to change the HSL value of the RGB LED. This should produce fairly chaotic results even though the carriage position will always produce the same RGB value the position of the pendulum will very rarely be directly under the carriage. So the colors in the image output will never be in the same location.
I’ve made good headway in fully conceptualizing the installation in what could be the final form but there is still a long way to go for realization.
The Five Tests
Five days, five tests to push this project along. All focusing on getting a motor to move with input from a sensor.
Smoothing
Using the example code for smoothing form the Arduino IDE, I wanted to see how averaging worked using a simple analogRead() with a rotatory potentiometer. This was pretty straight forward and worked as anticipated.
/*
  Smoothing

  Reads repeatedly from an analog input, calculating a running average and
  printing it to the computer. Keeps ten readings in an array and continually
  averages them.

  The circuit:
  - analog sensor (potentiometer will do) attached to analog input 0

  created 22 Apr 2007
  by David A. Mellis  <dam@mellis.org>
  modified 9 Apr 2012
  by Tom Igoe

  This example code is in the public domain.

  http://www.arduino.cc/en/Tutorial/Smoothing
*/

// Define the number of samples to keep track of. The higher the number, the
// more the readings will be smoothed, but the slower the output will respond to
// the input. Using a constant rather than a normal variable lets us use this
// value to determine the size of the readings array.
const int numReadings = 10;

int readings[numReadings];      // the readings from the analog input
int readIndex = 0;              // the index of the current reading
int total = 0;                  // the running total
int average = 0;                // the average

int inputPin = A0;

void setup() {
  // initialize serial communication with computer:
  Serial.begin(9600);
  // initialize all the readings to 0:
  for (int thisReading = 0; thisReading < numReadings; thisReading++) {
    readings[thisReading] = 0;
  }
}

void loop() {
  // subtract the last reading:
  total = total - readings[readIndex];
  // read from the sensor:
  readings[readIndex] = analogRead(inputPin);
  // add the reading to the total:
  total = total + readings[readIndex];
  // advance to the next position in the array:
  readIndex = readIndex + 1;

  // if we're at the end of the array...
  if (readIndex >= numReadings) {
    // ...wrap around to the beginning:
    readIndex = 0;
  }

  // calculate the average:
  average = total / numReadings;
  // send it to the computer as ASCII digits
  Serial.println(average);
  delay(1);        // delay in between reads for stability
}
Smoothing-VL53L0X
Since one of the variables I will be using in the final installation is proximity or distance, I decided to use the Adafruit VL53L0X breakout board to test the smoothing code. I played with the const int numReadings to see how this changed the output of the averaging. As expected the more values held in the array the slower the average changed, this will affect how fast the motor is told to change position.
#include "Adafruit_VL53L0X.h"

Adafruit_VL53L0X lox = Adafruit_VL53L0X();

const int numReadings = 50;

int readings[numReadings];      // the readings from the analog input
int readIndex = 0;              // the index of the current reading
int total = 0;                  // the running total
int average = 0;                // the average

int distance;
//int inputPin = A4;

void setup() {
  // initialize serial communication with computer:
  Serial.begin(115200);

 // initialize all the readings to 0:
  for (int thisReading = 0; thisReading < numReadings; thisReading++) {
    readings[thisReading] = 0;
  }

  // wait until serial port opens for native USB devices
  while (! Serial) {
    delay(1);
  }

  Serial.println("Adafruit VL53L0X test");
  if (!lox.begin()) {
    Serial.println(F("Failed to boot VL53L0X"));
    while(1);
  }

  // power
  Serial.println(F("VL53L0X API Simple Ranging example\n\n"));
  }

void loop() {
  VL53L0X_RangingMeasurementData_t measure;
  distance = measure.RangeMilliMeter;

//  Serial.print("Reading a measurement... ")
  lox.rangingTest(&measure, false); // pass in 'true' to get debug data printout!
//  Serial.print("Distance (mm): ");Serial.println(distance);
  delay(100);

  // subtract the last reading:
  total = total - readings[readIndex];
  // read from the sensor:
//  readings[readIndex] = analogRead(inputPin);
readings[readIndex] = distance;
  // add the reading to the total:
  total = total + readings[readIndex];
  // advance to the next position in the array:
  readIndex = readIndex + 1;

  // if we're at the end of the array...
  if (readIndex >= numReadings) {
    // ...wrap around to the beginning:
    readIndex = 0;
  }

  // calculate the average:
  average = total / numReadings;
  // send it to the computer as ASCII digits
  Serial.print("D");Serial.print(distance);Serial.print("A");Serial.println(average);
//  Serial.print("Average");Serial.println(average);
  delay(10);        // delay in between reads for stability
}
Pololu USB Control
Pololu has a very nice application for controlling the motor driver over USB. In this case I choose the Tic T834 which unfortunately was too low power to drive the NEMA 23 motors of the X-Carve I was testing with. Luckily I had a much smaller NEMA 8 that works great with this driver.
Pololu Tic T834 Position Control I2C
Next I wanted to droive the motor position using the library from Pololu and fixed position movement, in this case 200 steps clockwise and then -200 steps counter clockwise.
#include <Tic.h>

TicI2C tic;

void setup()
{
  // Set up I2C.
  Wire.begin();

  // Give the Tic some time to start up.
  delay(20);

  // Set the Tic's current position to 0, so that when we command
  // it to move later, it will move a predictable amount.
  tic.haltAndSetPosition(0);

  // Tells the Tic that it is OK to start driving the motor.  The
  // Tic's safe-start feature helps avoid unexpected, accidental
  // movement of the motor: if an error happens, the Tic will not
  // drive the motor again until it receives the Exit Safe Start
  // command.  The safe-start feature can be disbled in the Tic
  // Control Center.
  tic.exitSafeStart();
}

// Sends a "Reset command timeout" command to the Tic.  We must
// call this at least once per second, or else a command timeout
// error will happen.  The Tic's default command timeout period
// is 1000 ms, but it can be changed or disabled in the Tic
// Control Center.
void resetCommandTimeout()
{
  tic.resetCommandTimeout();
}

// Delays for the specified number of milliseconds while
// resetting the Tic's command timeout so that its movement does
// not get interrupted by errors.
void delayWhileResettingCommandTimeout(uint32_t ms)
{
  uint32_t start = millis();
  do
  {
    resetCommandTimeout();
  } while ((uint32_t)(millis() - start) <= ms);
}

// Polls the Tic, waiting for it to reach the specified target
// position.  Note that if the Tic detects an error, the Tic will
// probably go into safe-start mode and never reach its target
// position, so this function will loop infinitely.  If that
// happens, you will need to reset your Arduino.
void waitForPosition(int32_t targetPosition)
{
  do
  {
    resetCommandTimeout();
  } while (tic.getCurrentPosition() != targetPosition);
}

void loop()
{
  // Tell the Tic to move to position 100, and wait until it gets
  // there.
  tic.setTargetPosition(100);
  waitForPosition(100);

  // Tell the Tic to move to position -100, and delay for 3000 ms
  // to give it time to get there.
  tic.setTargetPosition(-100);
  delayWhileResettingCommandTimeout(3000);
}
Tic T834 using the VL53L0X for position control
Finally this is still a work in progress as demonstrated by the video below, I do not currently have this working. However, it is only a matter of time to figure it out.
#include "Adafruit_VL53L0X.h"

Adafruit_VL53L0X lox = Adafruit_VL53L0X();
unsigned long startMillis;
unsigned long currentMillis;
const unsigned long period = 4000;
const int numReadings = 10;

int readings[numReadings];      // the readings from the analog input
int readIndex = 0;              // the index of the current reading
int total = 0;                  // the running total
int average = 0;                // the average

int distance = 0;
//int inputPin = A4;

void setup() {
  // initialize serial communication with computer:
  Serial.begin(115200);

  // initialize all the readings to 0:
  for (int thisReading = 0; thisReading < numReadings; thisReading++) {
    readings[thisReading] = 0;
  }

  // wait until serial port opens for native USB devices
  while (! Serial) {
    delay(1);
  }

  Serial.println("Adafruit VL53L0X test");
  if (!lox.begin()) {
    Serial.println(F("Failed to boot VL53L0X"));
    while (1);
  }
  // power
  Serial.println(F("VL53L0X API Simple Ranging example\n\n"));
  startMillis = millis();  //initial start time
}

void loop() {
  currentMillis = millis();

  VL53L0X_RangingMeasurementData_t measure;
  distance = measure.RangeMilliMeter;


  lox.rangingTest(&measure, false); // pass in 'true' to get debug data printout!
  delay(100);

  // subtract the last reading:
  total = total - readings[readIndex];
  // read from the sensor:
  //  readings[readIndex] = analogRead(inputPin);
  readings[readIndex] = distance;
  // add the reading to the total:
  total = total + readings[readIndex];
  // advance to the next position in the array:
  readIndex = readIndex + 1;

  // if we're at the end of the array...
  if (readIndex >= numReadings) {
    // ...wrap around to the beginning:
    readIndex = 0;
  }

  // calculate the average:
  average = total / numReadings;
  int  steps = map(average, 0, 9000, -400, 400);
  // send it to the computer as ASCII digits
  Serial.print("Distance"); Serial.println(distance);
  Serial.print("Average"); Serial.println(average);

  if (currentMillis - startMillis <= period) {
    analogWrite(A0, steps);
    //  delay(5000);        // delay in between reads for stability
  }
  startMillis = currentMillis;
}
A few things to note, I was using an Arduino Uno R3 to start with, this worked well for driving the motor as it is a 5V native board, however, the Uno had some issues when interfacing with the Adafruit VL53L0X. Adafruit claims comatibility with the Uno and 5V but for some reason I wopuld get negetive numbers in both the distance reporting for the sensor and the averaging. I’m not sure why this was the case but changing the board to an Arduino Nano 33 IoT made everything function as expected.

PIVOT!
Dear reader, if you have been paying attention and have a good memory you will recall the PenduLight system was based on a single point of rotation via a motor. That point of rotation was connected to a a compound lever resulting in a varied attachment point for the pendulum. This was a good start, however, the output was mostly circular with some small anomalies in path. Interesting outcomes but they could be more interesting still. Enter the use of an X/Y gantry otherwise known as a cartesian robot. The use of the X/Y gantry will allow for many more variations in path.
Each axis of the X/Y gantry will have 2 variables to feed data into, the travel distance and the speed of travel. Both variables will be collected form sensors in the room/installation. The data to be collect has not been decided upon but some options are number of people entering and exiting the room, ambient volume, and more than likely there will be a random element to one variable on each axis.
Below you will find a a visualization of the reasinging behind switching form the “single point of rotation via a motor system” to the X/Y gantry.
After deciding to change from the stationary single rotation point to the X/Y gantry system of attaching the pendulum, I wanted to see if my theory about the outputs was correct. I held the pendulum attachment point above the camera and moved it randomly inside an 8in x 8in square bounding box and recorded the movements. As expected there was more varied output. Which is what I was aiming for, this little exercise also showed me that quick change movements did not have as much impact with the final output. I will be able to use this information to aid in how the gantry should move to produce the most varied outputs. Once I have the sensors controlling the movement, I will begin to change the speed, distance, and timing of the system.
PenduLight Project Proposal
Title: PENDULIGHT
A Summary of Your Project
A pendulum with an LED that projects the movement path onto a camera creating an image from a long exposure. The Image is displayed for 60 minutes and then is removed from the installation.
Vision Statement, Purpose of Your Project
The idea behind Pendulight is to illustrate the fleetingness of time and the permanence of death. Each image exists for exactly 60 minutes, once that time has elapsed it is gone forever. It becomes only a memory and eventually even the memory is gone. My hope is that this sequence of events suggests to the viewers to think more on what time is and how in the end eventually there is none left. Essentially this clock tries to put into perspective time and death as it relates to the human condition.
Ideal Audience / Venue
The ideal audience for this is really anyone who enjoys installation art. The ideal venue is a gallery or museum like the Hirshhorn.
Background/Concept/Story
The idea behind this project started as a way to map the kinetic energy of the pendulum. It has evolved into a large-scale installation dealing with time and death.
Project Description
Pendulight is a room-sized installation consisting of four main components: a pendulum, a control console, a camera, and a series of screens or projections configured in a stripe around the circumference of the room. An RGB LED in the pendulum responds to a number of different data sets collected from the room or the pendulum’s movement. These datasets include: speed of the pendulum, x/y location of the pendulum, room humidity, room temperature, ambient sound level of the room, and possibly more. The pendulum is suspended from a variable point which is in turn connected to a stepper. The control console allows the user to adjust the speed and direction of the servo, and select the mode for the LED response. With user input to the servo the movement of the pendulum is unpredictable and is highly unlikely to repeat. As the pendulum moves the camera, which is located inline with the stepper on the floor pointing up, captures a 1 minute exposure. After the exposure is finished the resulting image is projected or displayed on a segment of the stripe located directly to the right of the entrance of the room. This process continues as long as the pendulum is in motion. After 60 minutes the first image has been displayed sequentially in all 60 locations around the room and is now directly to the left of the room entrance. At minute 61 the image is no longer displayed and no record of it is kept. This happens for every image that is created.
The installation requires a number of different materials and technologies.
How is Your Project Different?
Anita Chowdry Light photos involving pendulums
Scott LeBlanc One example of light photo involving a pendulum
Steve Throndson LIght photography using pendulums
All of the above capture the movement of a pendulum with a long exposure but let the pendulum travel a natural path, once the pendulum is let go the path is not interfered by outside inputs; as well as the images are captured and printed and displayed in perpetuity.
My iteration of this project is the addition of the variable pivot point and user input of the pivot and the way the images are displayed in a room sized installation. And each image only lasts for exactly 60 minutes.
Expert/Mentor List
James Nolan Gandy makes mechanical drawing machines, not the same but in principle the mechanical aspect could be used to iterate on movement methods.
RAFAEL LOZANO-HEMMER very interesting installation using input from viewers to create elements of the artwork other works link
Tom Igoe
Jeff Fedderson
What and How
What are specific objects you would like to achieve within your project? If they’re specific features, describe the technologies you think you will use, and include a rough timetable of activities with dates and objectives.
Dream Review
Room-sized Pendulum Displays Data Through Color, Experience Parallels Life Cycle
Artist and designer Phil Caridi has created an intriguing representation of time, motion, and chaos through the use of light and a pendulum. Entering the dimly lit room feels like entering a void. Along the perimeter of the room is a black stripe. At the far end of the room there is a pedestal with a number of controls placed on top of it.
Making your way to the control pedestal reveals that the black strip is actually a series of screens and suspended from the center of the room is a small pendulum. Once at the control pedestal the user is confronted with six touchpoints: speed of the motor (a knob), direction of the motor(a toggle switch),and a mode select (a knob) with indications for speed, direction, or velocity of the pendulum, as well as an indicator for chaos.
As the first user of the day, the pendulum lies motionless at the center of the room. Interacting with the speed knob starts a motor, which starts the pendulum in motion, and illuminates the LED. The pendulum is connected to a linkage which is in turn connected to a motor. Input from the control pedestal and the user controls the speed and direction of the motor. The mode selection controls how the color of the RGB LED is mapped. The user has the choice of changing the color based on direction, speed, velocity, and chaos. The first three are straight forward, the pendulum has a sensor that can gather information and then change the color of the LED based on the data. Chaos is a bit harder to understand and will always output something completely different even if all the given data is exactly the same.
A camera seated directly under the pendulum records the movement in a one minute long exposure, when the exposure is finished the resulting image is displayed on the screen directly to the left of the door you entered through. After another minute the first image is moved clockwise one screen and the new image is displayed on the first screen. This process continues, once the first image reaches the 60th screen and is displayed for one minute it will move off the screen being lost forever. As long as the pendulum is in motion a new image will be captured every minute, however, once the motion in the pendulum stops there is no data to produce an image, the LED will switch off, and the remaining images will proceed around the room clockwise until the last image falls off the last screen leaving nothing but the black stripe around the room.
This installation is a powerful statement about the fleetingness of time and the permanence of death. Once the image has traversed its path along the 60 screens and is no longer displayed, there is no record, only memory of that image. The image exists for only 60 minutes ever, the time it takes for the minute hand to travel a clock face. This is a parallel to the cycle of life, for where we start we shall return.
The Computer’s Hallucination
What do computers see
while we leave them be
and on the couch we watch TV?
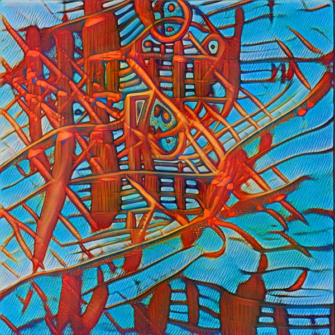
Resulting video from the audio mix and a model weight form styleGAN, my dataset, and birds.
Resulting video from the audio mix and a model weight form styleGAN, my dataset, and landscapes.
I used a base google colab notebook, VisionaryArtGenerator, altered it and then generated 7000 images from the input. Using those images as a dataset, I used a style GAN to create a .pkl file to input into another google colab notebook called Lucid Sonic Dreams.
VisionaryArtGenerator-https://colab.research.google.com/drive/1Zny3nZwzkGqzVd-PBQaEK48w9HC2SaL_?usp=sharing
Original .pkl to start the process-https://drive.google.com/file/d/1Vsx7oGYhGchjHyOs2UOzofaNNULsc3yJ/view?usp=sharing
https://colab.research.google.com/drive/1T6D9Dkjak19tiynIEBIIk4ozZbJd1yFN?usp=sharing
https://colab.research.google.com/drive/1T6D9Dkjak19tiynIEBIIk4ozZbJd1yFN?usp=sharing
BONUS ROUND


